Ⅰ. 插件描述
Modular visual interface for GDB in PythonⅡ. 基本信息
|
Ⅲ. 安装方法
使用Vundle管理器安装
在你的.vimrc下添加:Plugin 'cyrus-and/gdb-dashboard':source %
:PluginInstall对于Vundle版本 < 0.10.2,请用上面的Bundle替换Plugin。
使用NeoBundle管理器安装
在你的.vimrc下添加:NeoBundle 'cyrus-and/gdb-dashboard':source %
:NeoBundleInstall使用VimPlug管理器安装
在你的.vimrc下添加:Plug 'cyrus-and/gdb-dashboard':source %
:PlugInstall使用Pathogen管理器安装
在终端中运行以下命令:cd ~/.vim/bundle
git clone https://github.com/cyrus-and/gdb-dashboardⅣ. 文档说明
# GDB dashboard
GDB dashboard is a standalone .gdbinit file written using the [Python API][] that enables a modular interface showing relevant information about the program being debugged. Its main goal is to reduce the number of GDB commands needed to inspect the status of current program thus allowing the developer to primarily focus on the control flow.
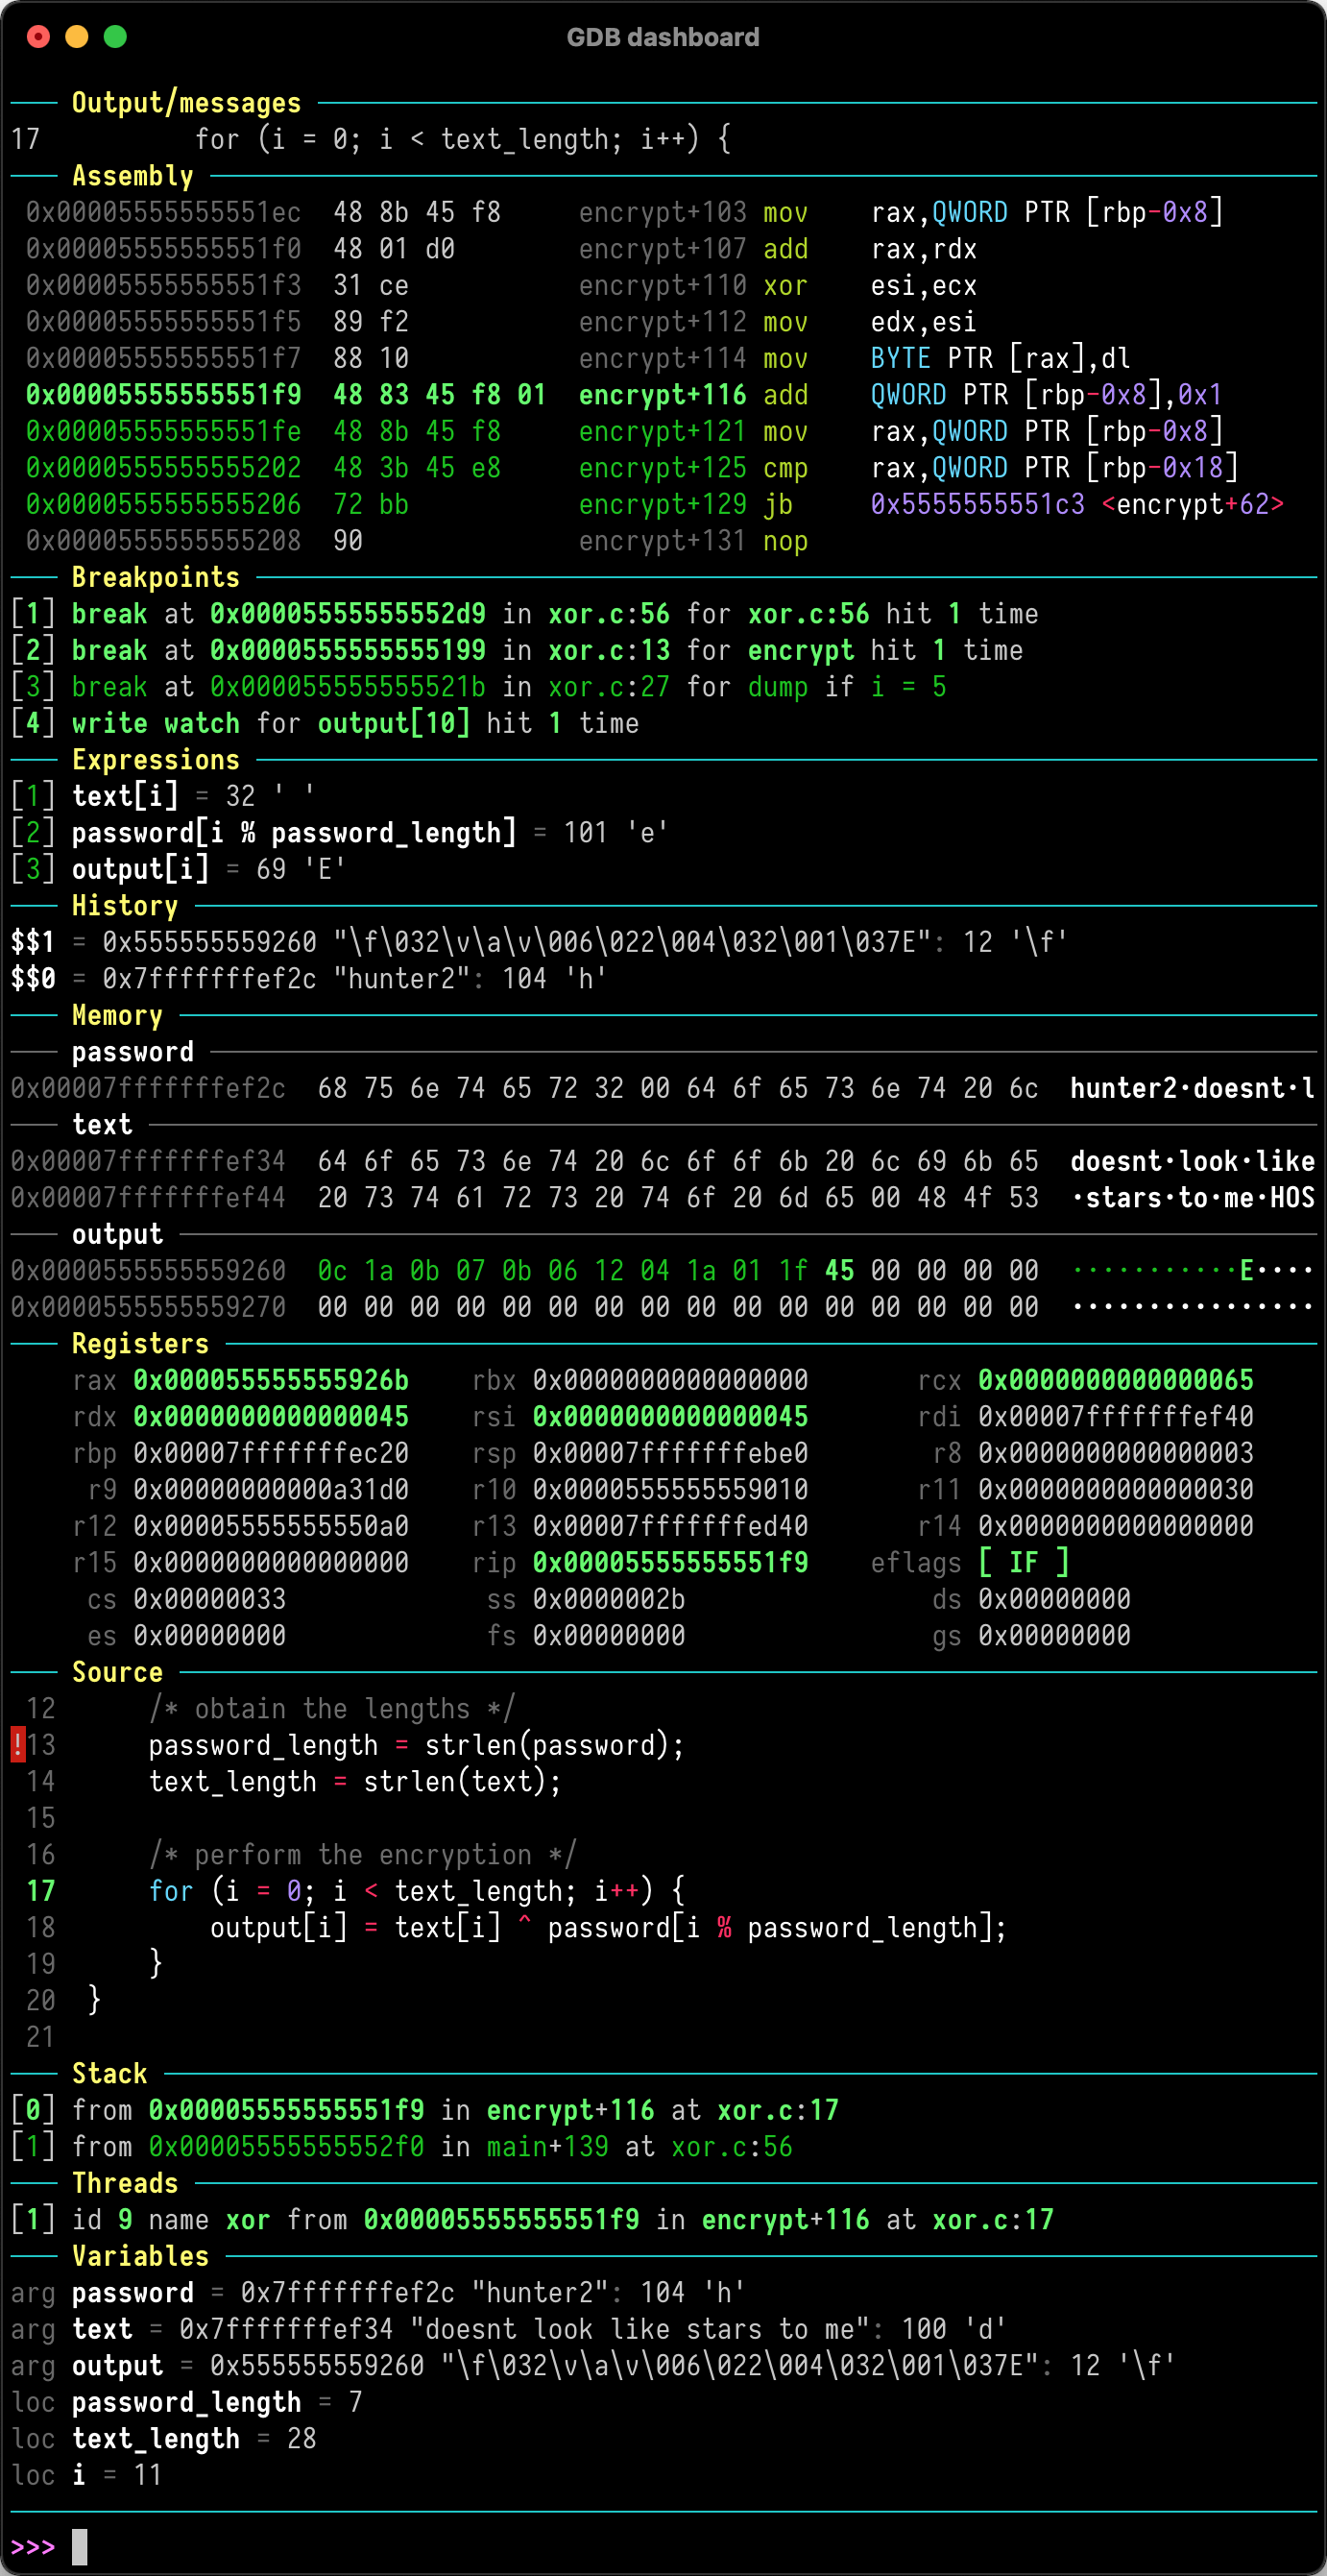
Quickstart
Just place [.gdbinit][] in your home directory, for example with:
wget -P ~ https://git.io/.gdbinitOptionally install [Pygments][] to enable syntax highlighting:
pip install pygmentsThen debug as usual, the dashboard will appear automatically every time the inferior program stops.
Keep in mind that no GDB command has been redefined, instead all the features are available via the main dashboard command (see help dashboard).
Head to the [wiki][] to learn how to perform the most important tasks.